
File:Aquatic Dead Zones.jpg

預覽大小:800 × 468 像素。 其他解析度:320 × 187 像素 | 640 × 375 像素 | 1,024 × 599 像素 | 1,280 × 749 像素 | 2,560 × 1,499 像素 | 3,577 × 2,094 像素。
原始檔案 (3,577 × 2,094 像素,檔案大小:856 KB,MIME 類型:image/jpeg)
摘要
| 描述 |
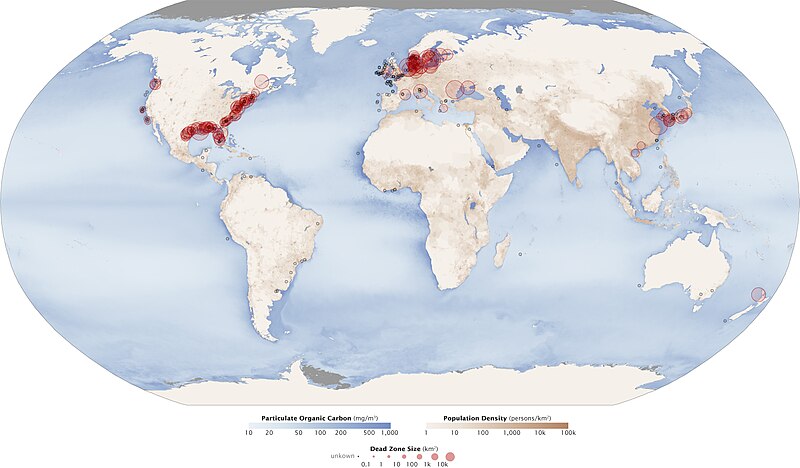
English: Red circles on this map show the location and size of many of our planet’s dead zones. Black dots show where dead zones have been observed, but their size is unknown. It’s no coincidence that dead zones occur downriver of places where human population density is high (darkest brown). Darker blues in this image show higher concentrations of particulate organic matter, an indication of the overly fertile waters that can culminate in dead zones. |
| 日期 | |
| 來源 | NASA Earth Observatory |
| 作者 | Robert Simmon & Jesse Allen |
Data from Robert Diaz, Virginia Institute of Marine Science (dead zones); the GSFC Ocean Color team (particulate organic carbon); and the Socioeconomic Data and Applications Center (SEDAC) (population density).
授權條款
| 本作品由NASA創作,屬於公有領域。根據NASA的版權政策:“NASA的創作除非另有聲明否則不受版權保護。”(參見:Template:PD-USGov/zh,NASA版權政策或JPL圖像使用政策) | ||
 |
警告:
|
檔案歷史
點選日期/時間以檢視該時間的檔案版本。
| 日期/時間 | 縮圖 | 尺寸 | 用戶 | 備註 | |
|---|---|---|---|---|---|
| 目前 | 2010年7月19日 (一) 12:17 | | 3,577 × 2,094(856 KB) | Originalwana | {{Information |Description={{en|1=Red circles on this map show the location and size of many of our planet’s dead zones. Black dots show where dead zones have been observed, but their size is unknown. It’s no coincidence that dea |
檔案用途
下列頁面有用到此檔案:
全域檔案使用狀況
以下其他 wiki 使用了這個檔案:
- ar.wikipedia.org 的使用狀況
- bs.wikipedia.org 的使用狀況
- cs.wikipedia.org 的使用狀況
- da.wikipedia.org 的使用狀況
- de.wikipedia.org 的使用狀況
- en.wikipedia.org 的使用狀況
- en.wikibooks.org 的使用狀況
- es.wikipedia.org 的使用狀況
- fa.wikipedia.org 的使用狀況
- fr.wikipedia.org 的使用狀況
- it.wikipedia.org 的使用狀況
- ja.wikipedia.org 的使用狀況
- ml.wikipedia.org 的使用狀況
- pl.wikipedia.org 的使用狀況
- pt.wikipedia.org 的使用狀況
- ru.wikipedia.org 的使用狀況
- simple.wikipedia.org 的使用狀況
- tr.wikipedia.org 的使用狀況
- uk.wikipedia.org 的使用狀況