跳至內容

File:Associated Legendre Poly.svg

頁面內容不支援其他語言。
這個檔案來自維基共享資源
維基百科,自由的百科全書

原始檔案(SVG 檔案,表面大小:540 × 360 像素,檔案大小:48 KB)


摘要

描述
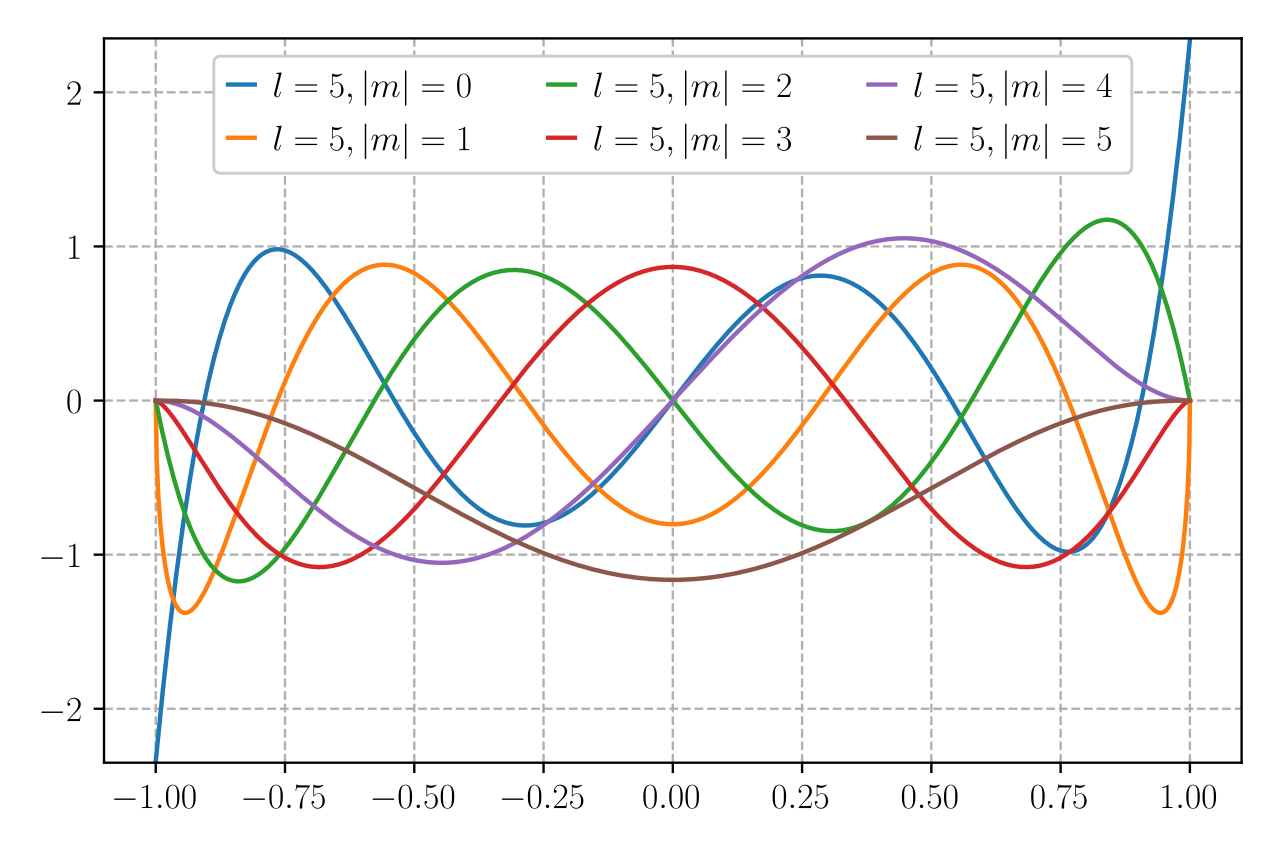
English: Curves of Associated Legendre function. The functions are normalized, i.e. what is plotted is
日期
來源 自己的作品
作者 Krishnavedala
SVG開發
InfoField
 
SVG檔案的原始碼通過W3C驗證
 
向量圖形使用Matplotlib創作。
原始碼
InfoField

Python code

Source code
#include    <stdio.h>
#include    <stdlib.h>
#include    <math.h>
#include    <unistd.h>
#include    <gsl/gsl_sf_legendre.h>
#include    <plplot/plplot.h>

#ifndef PI
#define PI    3.1415926535897932384
#endif

#define		modulus(a)		(a > 0 ? a : -a)

typedef struct quant_num
{
	int l, m, n;
} quant_num;

const long unsigned int NUM_PTS = 5000;
const PLINT XMAX = 1;
const PLINT YMAX = 1;

void aLegendre(PLFLT *x, PLFLT *y, quant_num *numbers)
{
	long unsigned int i = 0;
	float step = 2.0/NUM_PTS, t = -1.0;
	
	while(t < 1.0 && i < NUM_PTS)
	{
		x[i] = (PLFLT)t;
		y[i] = (PLFLT)gsl_sf_legendre_sphPlm(numbers->l, abs(numbers->m), (const double)t);
		i++;
		t += step;
	}
}

void drawlegend(int n)
{
	PLINT 	nLegend = n+1;
	char 	*text[nLegend];
	int i;
	PLINT	opt_array[nLegend];
	PLINT	text_colors[nLegend];
	PLINT	line_colors[nLegend];
	PLINT	line_styles[nLegend];
	PLINT	line_widths[nLegend];
	PLINT 	symbol_numbers[nLegend];
	PLINT 	symbol_colors[nLegend];
	PLINT 	symbols[nLegend];
	PLFLT	symbol_scales[nLegend];
	PLINT	box_colors[nLegend] = {15};
	
	symbol_numbers[n] = n;
	symbol_colors[n] = n;
	symbols[n] 		 = '.';
	symbol_scales[n] = 1.;
	
	for(i = 0; i <= n; i++)
	{
		text[i] = malloc(15 * sizeof(char));
		if(i>0)
			sprintf(text[i], "l=5, &#124;m&#124;=%d",i);
		else
			sprintf(text[i], "l=5, m=%d",i);
		line_colors[i]	= i+1;
		line_styles[i]	= 1;
		line_widths[i]	= 1;
		text_colors[i] 	= 15;
		opt_array[i] 	= PL_LEGEND_LINE;
	}
	
	pllegend(0, 0.72, .87, .05, 15,
		nLegend, opt_array, 0.5, 0.7, 1.5, 0,
		text_colors, (const char**) text, 
		box_colors, NULL, NULL, 
		line_colors, line_styles, line_widths,
		symbol_colors, symbol_scales, symbol_numbers, symbols);
	for(i = 0; i <= n; i++)
		free(text[i]);
}

int main(void)
{
    PLFLT X[NUM_PTS], Y[NUM_PTS];
    quant_num test_num[6];
    int i;
	
    plscol0(0, 255, 255, 255);
    plinit();
    plscol0(15, 0, 0, 0);
    plcol(15);
    plenv(-XMAX,XMAX, -YMAX,YMAX, 0, 2);

    pllab("x", "P#dl#u#um#d(x)", "Associated Legendre Polynomials");
    plbox( "bcnst", 0, 0, "bcnstv", 0, 0);    plcol(1);
    for(i = 0; i <= 5; i++)
    {
		test_num[i].l = 5; 	test_num[i].m = i; 	test_num[i].n = 1; 
		orbital(X, Y, &test_num[i]); plcol(i+1);
		plline(NUM_PTS, X, Y);
    }

    drawlegend(test_num[0].l);
    
    plend();

    return 0;
}

Data

Source code
import matplotlib.pyplot as plt
from scipy.special import lpmv
import numpy as np
plt.rc('svg', fonttype='none')
plt.rc('text', usetex=1)

dt = 1e-3
l = 5
x = np.arange(-1, 1, dt)
y = []
for m in range(l+1):
    y.append(lpmv(m, l, x))
    
fig, ax = plt.subplots(1,1, figsize=(10,6))
for m in range(l+1):
    ax.plot(x, y[m] / np.linalg.norm(y[m]), label=r'$l=%d, &#124;m&#124;=%d$' % (l, m))
ax.grid(True)
ax.legend()
ax.minorticks_on()
ax.set_xlim([-1,1])
ax.set_xlabel(r'$x$')
ax.set_ylabel(r'$P_l^m(x)$')
fig.savefig('legendre.svg', bbox_inches='tight')

授權條款

我,本作品的著作權持有者,決定用以下授權條款發佈本作品:
w:zh:共享創意
姓名標示 相同方式分享
您可以自由:
  • 分享 – 複製、發佈和傳播本作品
  • 重新修改 – 創作演繹作品
惟需遵照下列條件:
  • 姓名標示 – 您必須指名出正確的製作者,和提供授權條款的連結,以及表示是否有對內容上做出變更。您可以用任何合理的方式來行動,但不得以任何方式表明授權條款是對您許可或是由您所使用。
  • 相同方式分享 – 如果您利用本素材進行再混合、轉換或創作,您必須基於如同原先的相同或兼容的條款,來分布您的貢獻成品。
GNU head 已授權您依據自由軟體基金會發行的無固定段落、封面文字和封底文字GNU自由文件授權條款1.2版或任意後續版本,對本檔進行複製、傳播和/或修改。該協議的副本列在GNU自由文件授權條款中。
您可以選擇您需要的授權條款。

說明

添加單行說明來描述出檔案所代表的內容

在此檔案描寫的項目

描繪內容

沒有維基數據項目的某些值

作者姓名字串 繁體中文 (已轉換拼寫):​Krishnavedala
維基媒體使用者名稱 繁體中文 (已轉換拼寫):​Krishnavedala

著作權狀態 繁體中文 (已轉換拼寫)

有著作權 繁體中文 (已轉換拼寫)

檔案來源 Chinese (Taiwan) (已轉換拼寫)

上傳者的原創作品 繁體中文 (已轉換拼寫)

多媒體型式 繁體中文 (已轉換拼寫)

image/svg+xml

校驗和 繁體中文 (已轉換拼寫)

16ecdc42e0ba939e12c1f09283ede01be5608034

斷定方法:​SHA-1 中文 (已轉換拼寫)

49,502 位元組

360 像素

540 像素

檔案歷史

點選日期/時間以檢視該時間的檔案版本。

日期/時間縮⁠圖尺寸用戶備⁠註
目前2020年12月3日 (四) 20:38於 2020年12月3日 (四) 20:38 版本的縮圖540 × 360(48 KB)AkanoToEAdjusted normalization, legend formatting, and text formatting
2018年4月24日 (二) 22:05於 2018年4月24日 (二) 22:05 版本的縮圖785 × 466(69 KB)KrishnavedalaReverted to version as of 21:58, 24 April 2018 (UTC) - fonts not rendered properly on wiki
2018年4月24日 (二) 22:04於 2018年4月24日 (二) 22:04 版本的縮圖795 × 468(47 KB)Krishnavedalaremoved embedded fonts - smaller file size
2018年4月24日 (二) 21:58於 2018年4月24日 (二) 21:58 版本的縮圖785 × 466(69 KB)Krishnavedalarecreated better clarity and smaller size
2010年11月25日 (四) 14:31於 2010年11月25日 (四) 14:31 版本的縮圖900 × 675(508 KB)Krishnavedala{{Information |Description={{en|1=Curves of Associated Legendre function generated in C program using the PLplot library.}} |Source={{own}} |Author=[[User:Krishnavedala|

下列頁面有用到此檔案:

全域檔案使用狀況

以下其他 wiki 使用了這個檔案:

詮釋資料